I wanted to find the number of citations per year for a paper from my dad, at least per Google Scholar. Hacking around, here’s a little JavaScript to get it per results page:
function extract(resultNode) {
  const titleElem = resultNode.querySelector(".gs_rt");
  const titleLink =  titleElem.querySelector("a");
  let title = "";
  let url = "";
  let authors = "";
  let year = "";
  let publisher = "";
  if (titleLink) {
    title = titleLink.textContent;
    url = titleLink.href;
  } else {
    title = titleElem.querySelector("span[id]").textContent;
  }
  const authorDateString = resultNode.querySelector(".gs_a").textContent;
  const authorDateMatch = /^(.+)\s-\s[^-]*\s*(\d{4})\s-\s([^-]+)/.exec(authorDateString);
  if (authorDateMatch) {
    authors = authorDateMatch[1];
    year = authorDateMatch[2];
    publisher = authorDateMatch[3];
  } else {
    console.log("Didn't get author date match", authorDateString);
    const authorMatch = /^(.+)\s-\s([^-]+)/.exec(authorDateString);
    if (authorMatch) {
      authors = authorMatch[1];
      publisher = authorMatch[2];
    } else {
      console.log("Didn't get author match", authorDateString);
      authors = authorDateString;
    }
  }
  return {
    title,
    url,
    authors,
    year,
    publisher
  };
}

console.log(JSON.stringify([...document.querySelectorAll(".gs_ri")].map(e => extract(e))))
How would you do this? Is there a nicer way to do it?
There were 12 results pages. I was paranoid about getting blocked by Google from automating this any further so I executed this 12 separate times… not that bad since the Chrome console remembers the history from the previous page so it just takes one up arrow press to be ready to run it again.
Then I had a little fun hacking in the Python console:
import csv
import glob
import itertools
import json

def read_json(path):
  with open(path, "rt", encoding="utf8") as f:
    return json.load(f)

def write_csv(rows, path):
  if not rows:
    return
    with open(path, "wt", encoding="utf8") as f:
      w = csv.DictWriter(f, fieldnames=list(rows[0].keys()))
      w.writeheader()
      w.writerows(rows)

results = list(map(read_json, sorted(glob.glob("*.json"))))
write_csv(results, path="results.csv")
One thing I re-learned here: you get one chance to convert from map‘s output to a list. If you call list on the map output a second time, you get empty list. I was a little surprised that it’s stateful like that.
The results: https://docs.google.com/spreadsheets/d/1MpPonbKbWnegHxPTJlP-Xz6X9U75Pi1fhmCLQ1AsdtQ/edit?usp=sharing
Finally, I decided to start by plotting it in Sheets. A first step was aggregating the count per year. I got a little help from the built-in AI fixing my query… turns out that I needed to say IS NOT NULL instead of <> '':
=QUERY(results!A1:E1000, "SELECT D, COUNT(D) WHERE D IS NOT NULL GROUP BY D", 1)
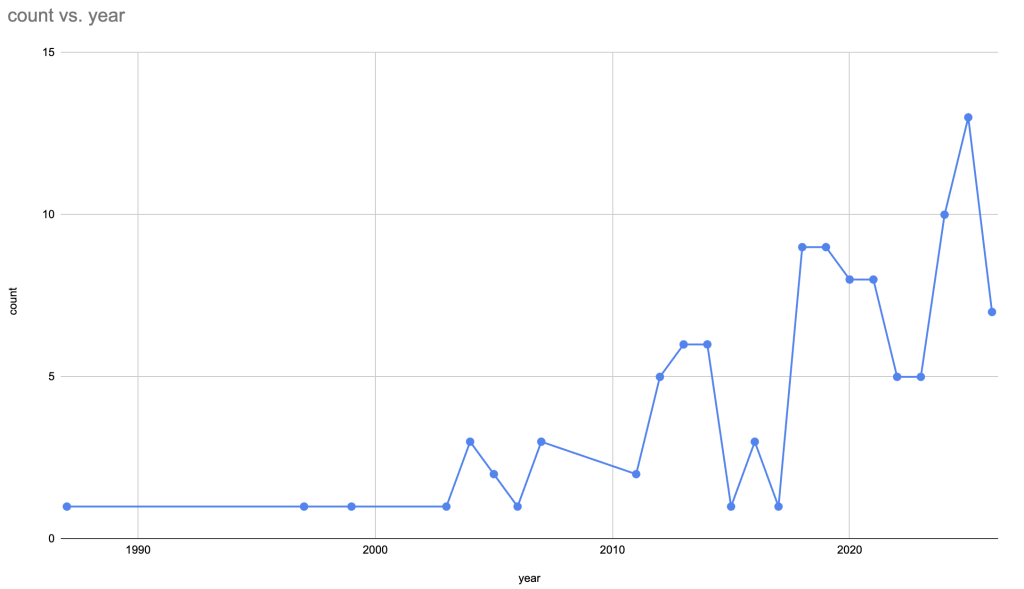
The peak is 13 citations in 2025. This roughly matches the display from Google Scholar, which I had thought was a little too incomplete, missing earlier years. But Google Scholar’s plot says there were 14 citations in 2025. Huh?
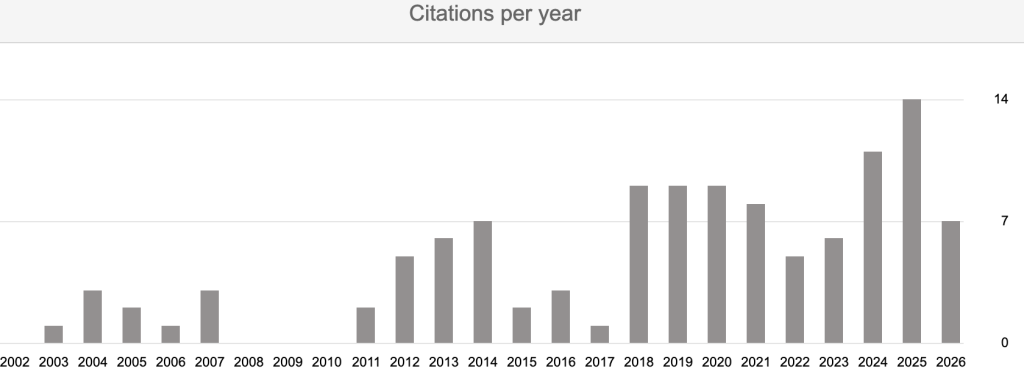
Ah… “Nondeterministic behaviors in the double operadic theory of systems”, which doesn’t list a year in its author section, is getting counted as being in 2025.
The plot from Sheets looks a little ugly. Let’s play around in R with ggplot2:
> library(ggplot2)
> citations <- read.csv("results.csv", stringsAsFactors=FALSE)
> ggplot(citations, aes(x=year)) + geom_bar()
Warning message:
Removed 6 rows containing non-finite outside the scale range (`stat_count()`). 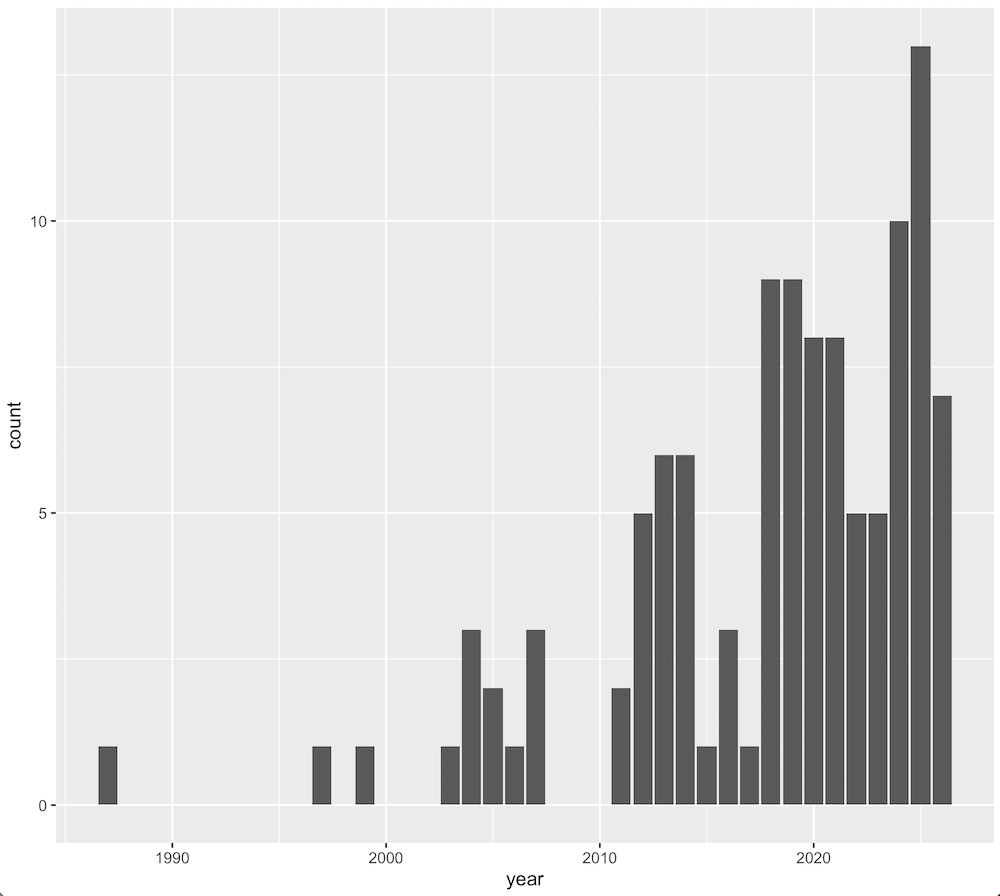
Normally, I don’t use bar charts, but it’s hard to see the trend without connecting the points with lines. However, as we saw in the Google Sheets chart, without some extra work — which I didn’t do — you end up treating points which should really be zeros as missing, leading to lines which are misleadingly flat across gulfs where they should dip down to zero.
> ggplot(citations, aes(x=year)) + geom_point(stat="count") + geom_line(stat="count")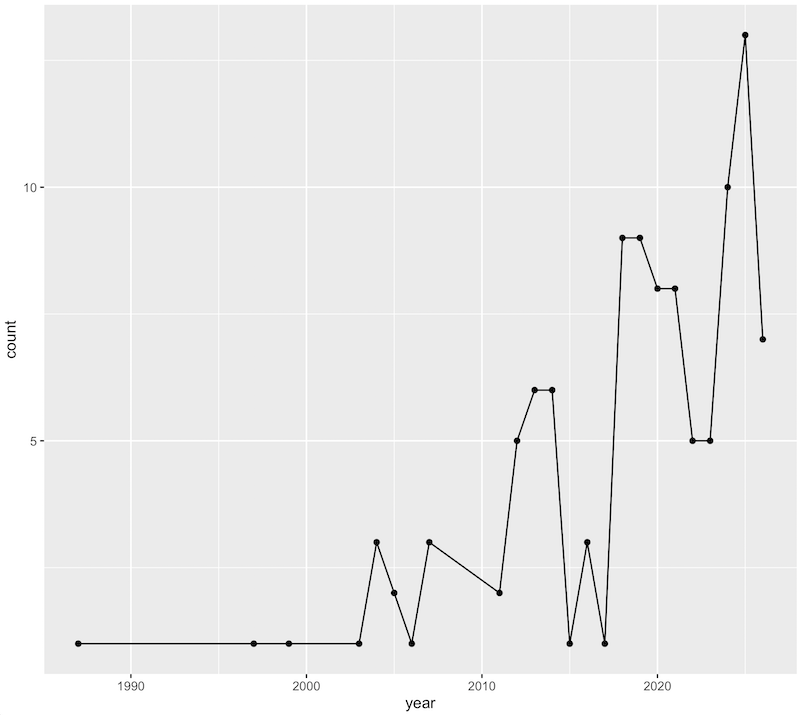
Leave a Reply